


INTRODUCTION
Dairy farms under Government control before 1975 included the Holleta Dairy (Ministry of Agriculture), and Shola Dairy (Dairy Development Agency), consolidated into 19 state dairy farms with 1,734 dairy cattle. A dominant milking herd was introduced when the Cuban Government donated 120 Holstein-Friesian heifers/cows in 1980. With the political changes in the last 30 years, many reports and studies on the livestock sector accomplished by Ethiopian researchers insisted on the same challenges over decades [1–6]. The detailed solutions were suggested by the official development asssistance (ODA) donor countries [7–9], organizations belonged United Nations [10,11], but the past efforts and the impact of political changes resulted in categorizing dairy development in Ethiopia as commercial and smallholder using exotic, improved and indigenous breeds of cattle [12]. Our study aims to try to understand the reason for the stagnation of dairy development through direct interviews with farmers and indirect experience of foreign ODA organizations’ output so that we could suggest an executive plan for the KOICA project as a suitable implementation model. As the Korean-style dairy cooperatives have made remarkable achievements despite the short history of the dairy industry in 50 years, it will be worthy of exemplifying for the Ethiopian government organizations, the dairy industry, and dairy farmers. The challenges faced in the dairy sector of Ethiopia realized by the preliminary survey were summarized as follows.
It was estimated that the total number of cattle is over 70 million in 10 regions [13]. “Ye Lemat Tirufat” legacy, a national dairy, poultry and honey production improvement program, aims at achieving commercialization and scale-up of existing small-scale dairy. In particular, the goal is to reduce the number of existing dairy farms from 12.8 million to 9 million and to increase the ratio of households to 8.31% (148,199 households) of them possessing more than ten cows (Table 1). The ratio of high-performance breeds increased from 2.7% to 17%. Concerning cows’ productivity, three individual goals are determined as increase milk production from 1.45 L to 2.02 L/cow/d for local cattle breeds, from 6 L to 10.7 L/cow/d for crossbreed with exotic milking breeds, and 13 L to 17 L/cow/d for exotic milking breeds.
The numbers of households not own cattle are 3,731,833, which are not included the total owners in Ethiopia.
Adapted from CSA (2016) [13] with public domain.
SNNP, Southern nations, nationalities, and peoples.
On matters related to the dairy products processing sector, it was determined to increase the domestic market share of milk products from 30% to 60% by replacing imported milk products.
Overall, urban demand for milk in Ethiopia is driving the modernization of agricultural production systems. Urban proximity proved to directly affect dairy productivity, input decisions that dairy farmers make, and their access to “modern” value chains in the process of agricultural transformation [14]. It was estimated by setting-up empirical equations of the spatial autoregression model of the “spivreg” package in addition to urban proximity as an endogenous variable [15]. In Ethiopia, almost all milk and milk products are consumed domestically, and the demand is growing, but there is no substantial export market.
The dairy value chain so-called generally starts from the supply of raw milk to the market via the processing stages. However, there are two supply systems in the formal and the informal channels according to whether the unities are licensed/registered channels. Currently, the market shares that 93%–97.5% is supplied by the informal market and 2.5%–7% by the formal market of the national milk supply market [16]. On the other hand, of the raw milk produced in urban areas such as North Shewa in the vicinity of Addis Ababa, 53% of the raw milk collected by the formal chain and 48% by the informal chain was delivered to the processors for milk product processing [16]. The raw milk utilization form of the households was prioritized in that majority of the household was used for processing, home consumption, calf feeding, and sale. The consumption pattern of milk and milk products at home varies depending upon the amount produced per household, the market access, the year’s season, and the religious fasting period. The raw milk is used for processing in a variety of products in Bako Tibe district, Oromia regional state, such as fresh liquid milk, fermented milk (ergo), butter, cottage cheese (ayib), buttermilk (arrera), and whey (aguat) [17]. According to an assessment study for the outlets of butter, an open local market (62.7%) was a significant market flowing farm gate (21.3%) and delivery to the buyer (16.0%). The reason for the choice of outlets was because of reasonable prices (74.7%), and short distances (14.0%), reliable customers (6.7%), respectively. Also, the mode of payment is another reason because of cash preference. The frequent buyers in the areas were consumers (53.3%) and traders (46.7%). Nevertheless, the results showed differences depending on the type of agroecology categorized as lowland (n = 58), midland (n = 50), and highland (n = 42) [17]. The specific objectives of identifying factors affecting milk market participation decisions were studied by Ayyano et al. [18]. They used a multivariate probit model for identifying the market outlets’ choice decision factors. One hundred forty-two farmers among 1,558 household producers in the Kofale district of West Arsi Zone, the most common market outlet is the retailer (48.59%) with a supply of 3.93 L/d, and 42.25%, 40.68% of the producers sold to cooperatives and collectors with a supply of 3.86 and 3.4 L/d, respectively. Mamo et al. [19] studied the determination of the milk marketing channel of 475 urban and peri-urban dairy farms by a Multivariate Prohibit Model. The informal channel was dominated, but the choices were affected by education, farm experience, farm size, market distance, membership in local dairy cooperatives, price, and farm locations.
The milk consumption per capita in Ethiopia is deficient (19–20 L) compared to Kenya (115 L) and Uganda (65 L). One of the reasons can partly be ascribed to the religious fasting practices of the Ethiopian Orthodox Church [6]. 43% of the total population does not consume animal products such as dairy, meat, and eggs for about 200 days per year.
Most household consumers prefer raw milk because of its natural flavor (high-fat content), availability, and lower price. However, specific upper-income market segments prefer and can afford packaged processed milk [20]. The high cost, insufficient supply, and lack of promotion of nutritious diets also limit dairy product consumption. The most consumed products in the markets of Addis Ababa were pasteurized milk and powdered milk followed by cows’ milk (44.4%) and butter (36.5%) in 2016 [21]. However, it is worth noting that the preference for raw milk, aside from the price incentive, stems from the notion that pasteurized milk may be diluted and unhealthy. Although dairy products are supplied through formal and informal markets, about 78%–95% of milk is sold through the informal market. In a study on the consumption patterns for purchases of specific dairy products of the households dwelling in the area of Addis Ababa [22], the buyers’ preferences on the farm made cottage butter 94%, pasteurized milk 73%, cottage cheese 64%, raw milk 46%, factory yogurt 26%, imported powdered milk 12%, cottage yogurt 11%, factory cheese 9% among a total 384 dairy products. The authors emphasized that most dairy products are perishable, except cottage butter which can be processed into ghee (neter kibe), so they are consumed immediately, especially during fasting by Orthodox Christians. In CSA annual report [6], 15.4% of the milk produced is sold in the market, whereas 54.7% is consumed at home by traditional processing technologies, and the remaining 29.5% of milk into butter and cottage cheese (ayib). Despite pasteurized milk, cheese, butter, yogurt, ghee, cream, and ice cream being produced in Ethiopia, milk ice, ice confection, flavored milk, chocolate milk, fermented skim milk, sterilized milk, and milk powder are imported for diversified dairy products. Due to technical and economic constraints, the major dairy products found in the rural area are yogurt-like fermented/sour milk (ergo), traditional butter (kibe), traditional ghee (neter kibe), and cottage cheese (ayib) [23]. The price of traditional milk products is much lower than that of imported, US$1.10 and 1.78 per liter of pasteurized milk and UHT vs. 3.22–3.9 for UHT milk imported, US$1.4–2.0 and 3.80 per kg of yogurt and cottage cheese vs. 41.85 for the imported cheese, and butter is US$30.20 /kg [24]. Milk processing is now in the hand of the private sector but is struggling against unfair competition from the informal sector and imported similar dairy commodities. The dairy marketing system prevailed in Ethiopia consumers obtain dairy products manufactured by informal raw milk, which can be a potent risk for cows disease transmission.
The Ethiopian dairy farming systems are categorized under five operating systems according to agroecology. Pastoral farming is traditional livestock farming, agropastoral farming is traditional mixed crop-livestock farming in the lowland and the highland, and urban and peri-urban farming is specialized smallholder dairy farming and commercial intensive dairy farming [25]. The general household characteristics of three prevailing dairy production systems categorized by the size of the farm, large (≥ 30 heads), medium- and small (≤ 5 heads) size in 236 dairy farms of six districts of Tigray, Dire Dawa, Harar, and Oromia were investigated for the assessment of milk production constraints [26]. The preference ranking and dairy cattle production constraints were calculated as an index value with the principle of weighted average according to the following formula,
(Where, Rn = the last rank, R1 = the first rank, Cn = the % of respondents in the last rank, C1 = the % of respondents in the first rank)
The overall index to keep exotic dairy cow breeds revealed that in the pure Holstein Friesian dairy, producers kept dairy cattle mainly for milk production (0.46), whereas in the crossbreed dairy cattle owners were for both milk production and replacement heifers (0.43). This result implies that Ethiopia’s low-input and low-output dairy production systems were characterized and identified that the husbandry practices and the cow breed are vital for developing viable, systemized, and sustainable breeding programs. On the other hand, in Chiro and Gemechis districts of West Hararghe province, shortage of grazing land (93%) and disease (75%) were the significant challenges or constraints of respondents. Feed shortage was the second (65%) constraint of dairy cattle production [27]. Abegaz [28] insisted that the main constraints of indigenous cattle from 217 farms in Raya Kovo districts in North-Eastern Ethiopia were calving in the summer season and disease, parasites challenges, housing conditions, and lack of forage land.
DAIRY FARMING IN CENTRAL EAST OROMIA
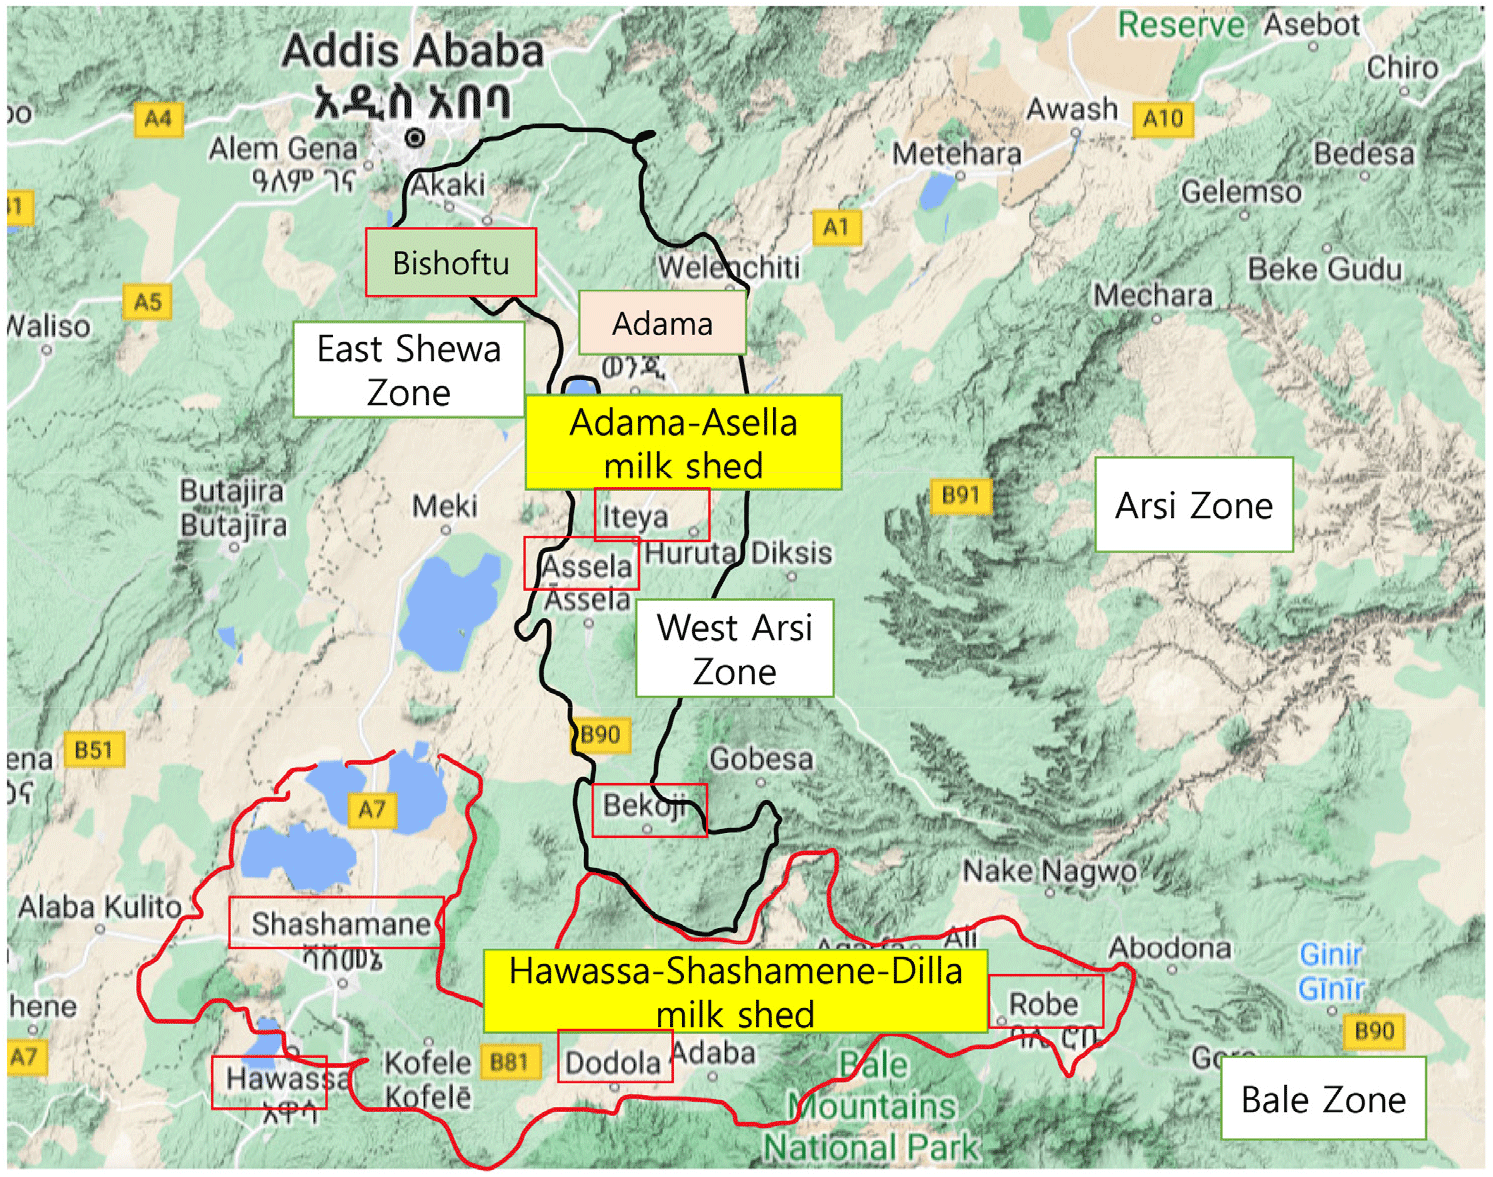
In Ethiopia, there are seven milk sheds: Ambo-Woliso, Hawassa-Shashamene-Dilla, Bahir Dar-Gondor, Mekele, Addis-Ababa, Adama-Asella, and Dire Dawa. Among these, Hawassa-Shashamene-Dilla and Adama-Asella milk sheds belong to central ast Oromia.
Kidane et al. [26] categorized the production systems of dairy farms into three major prevailing dairy production systems in the study; large-scale (> 30 cows), medium-scale (> 5 ≤ 30 cows), and small-scale (≤ 5 cows) dairy farms. Van Geel et al. [29] divided dairy farms into five types according to the method of using farmland in Oromia regional state, organized based on the results of a survey on specialized dairy companies in traditional breeding dairy farming and compared the farm status as follows.
The basic information on dairy farms by classifying the farm types in Oromia regional state into peri-urban farms using or not using farmland in the suburbs of the city, rural farms using farmlands that combine farms with other crop cereals or exclusive perennial farmland, and smallholder farms (urban SHF) in the vicinity of large cities, the farm management and herd performance, the composition of breed stock and lactation performance by the type of farmland use (Table 2).
Adapted from Van Gee et al. (2018) [29] with permission of Solidaridad, modified by the authors.
SHF, smallholder farms; NA, not available.
In Table 2, the breeding type, labor force, and milking frequency according to the type of farmland usage are milked twice a day regardless of the type of farmland used, and only 11% of farms are cooling milk at eight farms. If the milk is not cooled, it will cause severe deterioration problems in the milk and storage process until processing. Then the milk is unsuitable for processing, especially if it makes coagulum in the pipe when heat treated, resulting in the refusal of receiving milk.
The average number of breeding cows and herd performance by breeding type was also compared. The average number of breeding cows is 9.5, of which only 2.5 are milked. Urban SHF had the highest number of cows, with 13.4 cows and 7.0 cows for milking, and the total number of cows for permanent grassland (presumably pastoral grazing) farms was 5.9 cows and 0.8 cows for milking, showing a small herd size. Therefore, there is a difference in the size of breeding by farm type.
The average mortality rate of calves was 0.4, and the mortality rate of cows was 0.1. The high mortality rate of calves is probably because veterinary treatment was not provided immediately after a natural delivery. The annual milking yield is meager at an average of 1,407 kg, as suggested in Table 2. Also, looking at the first mating age and the parity interval according to breeding type, although the first mating month ordinally begins about 6 to 12 months, the average 34 months of the first delivery is relatively longer than the international average of 23–28 months. It may be caused by the severely low body condition score (BCS), the high number of mating failures, the late observation of the first menstruation, and the long parity interval. Because it shortens the economic life cycle of dairy cows, higher profitability per cow, establishing an ICT-controlled model farm, and accumulation of data-based digital dairy farming management technology are necessitated to support.
Looking at the number of heads and average body weight by breed in Table 2, farms in rural areas have a high ratio of native breeds and crossbreeds, while farms in urban areas focus on exotic breeds (urban SHF farms). Comparing the lactation performance by the breeding type, the average milking amount is 7.6 kg/d, much higher than the national average of 1.5 kg/d in Oromia regional state. Comparing the time to reach the peak milk production during the lactation, there is a prominent difference at 13.3 kg/d for exotic species and 8.4 kg/d for native species. The milk productivity is lower than that of the country group of lower milk yield (< 4,000 kg SCM/year) from the crossbreed and local breed fed with high fiber contents, and found mainly in the countries of Africa, South, and Southeast Asia and on the household farm in Eastern Europe [30]. In addition to this report, there are other problems, such as climate environment and the procurement of feed concentrates and supplementary feed.
The annual milk production of urban SHF farms raising Holstein’s exotic species was 3,616 kg. In contrast, farms using rural permanent grasslands raising native species stayed at 411 kg only, which is about nine folds. This report shows the difference between the type of farms, the level of raising and feeding technology, and the limitations of cow breeds. Therefore, distributing Holstein F1 crossbreeds between Holstein and local breeds is proposed in rural areas of the Oromia regional state.
Oromia regional state has two milk sheds, called Adama-Asella milk shed and Shashamene-Dodola-Robe milk shed (Fig. 1). Central-Eastern Oromia has four zones, Arsi, West Arsi, East Shewa, and Bale. There were 1.54 million dairy cows [6], and most of them were indigenous breeds. The number of milking cows in Arsi is the highest (about 507,362 heads), followed by West Arsi (498,730 heads), Bale (356,556 heads), and East Shewa (176,899 heads).
The number of crossbreeds was relatively high (115,358 heads) compared with the rest of the country. In 2021, there will be between 38,000 and 57,500 households with crossbreed cows. While crossbreed and grade cows, such as Holstine-Friesian, Jersey, and Simmental, represent 1.8 percent of total dairy cows in Ethiopia, they account for 47% in the Addis Ababa milk shed, where commercial farms and urban SHF farms are concentrated.
Most of the cows in the urban SHF system of the Addis Ababa milk shed are of the grade stock of Holstein-Friesian (over 97%), while in the rural farming system accounts for about 7% in Adama-Asella milk shed, and 26%–40% in the urban SHF system of the Shashamene–Dodola-Robe milk shed. The total milk production in Central-Eastern Oromia continuously grew to about 50,000 MT in 2015 compared with 45,200 MT in 2014, with an increase of 10.6%.
Adama-Asella milk shed covers Adama in the East Shewa zone to the north and Asella, the capital of the Arsi zone, to the south. Amada is a major city located about 90 km southeast of Addis Ababa and 75 km north of Asella. Adama and Bishoftu are included in the East Shewa zone alongside the Rift Valley. The climate of Adama is not considered suitable for raising dairy cows. However, the zone is a route connected to a dairy product consumption area or a large-scale consumption market (Addis Ababa). It is evaluated as a suitable place for processing and distribution. However, Asella city in Arsi Zone is a low-temperature highland with an altitude of over 2,400 m above sea level. It has been evaluated as a climate suitable for raising professional dairy farmers. The Ethiopian government has also been making ongoing efforts to modernize the dairy sector in the Arsi region (Fig. 1).
As of 2013/2014, among 64 dairy cooperatives, only 13 dairy cooperatives belonged to four dairy unions in Central East Oromia: Annan Arsi, Awash Olana, Galama, and Biftu Guddina, in two zones of Central East Oromia, except West Arsi zone and Bale zone (Table 3).
As of 2023, about 43 dairy cooperatives work in the 24 Woredas in the Arsi zone. The current status of the dairy cooperatives on cattle population and milk delivery distance to Asella is summarized in Table 4. Among them, 7 were in operation with solid activity, 17 were in operation but not strongly, 8 were not in operation, and the other 11 were no dairy cooperatives. 3,517,628 cattle are raised in the Arsi zone within 8–260 km of Asella. The largest district based on the number of dairy cows is district Lemmu/Bilbillo (262,107 heads) and followed by district Sude (258,272 heads), and district Shirak (218,042 heads) within 100 km from the Asella city, but Sude and Shirak formed no dairy cooperatives.
Dairy cooperative in operation with strong activity (○○), and in operation but not strongly (○), not in operation (△), and no responded to their activities (×).
NA, not available.
When it considers dairy cattle owners of more than 12.8 million, as summarized in Table 1, there are many members of 1,730 farmers of 40 dairy cooperatives. The gender ratio of females to males is 2.8:1. The most active dairy cooperatives are located in the vicinity of Asella within a boundary of 8–56 km. Although most cooperatives were established in 1997–2000, the oldest was Naano Bocojjii in 1992, and the latest was Lemmuu Cirque in 2017.
As a legal entity, the dairy cooperative is operated by a management committee composed of 5–7 members elected by general assemblies and comprised of several sub-committees (3 members each). Each sub-committee may have tasks such as inspection, procurement and sales, gender, loans, and training. The operation staff, such as technicians, salespersons, managers, and accountants, are usually hired but cannot be a member of the committee. The dairy cooperatives can operate as milk collection units and dairy processing units. In the Oromia regional state, three or more cooperatives operate in each woreda (Table 4), usually at most one in Amhara and Southern Nations, Nationalities, and Peoples’ Region (SNNPR) [31].
The role of the dairy cooperatives in milk collection is to receive fresh milk from 131 milk collection centers (MCCs) stored in 56 tanks under the operation of 180 cooling tanks installed by the processors nationwide [31]. One of the roles of dairy cooperatives is to process milk. Also, some MCCs fill milk products into commercial packages, such as skimmed milk, butter, and cheese, for distribution to the retail markets through the formal channel [31]. Also, dairy cooperatives functioned generally, taking tasks of procuring and distributing inputs and providing extension services to farmers (Table 5).
| Unit structure | Management/operation | Functions | Compose level |
|---|---|---|---|
| Dairy cooperative | |||
| Milk collection centre (MCC) | |||
| Milk collection group (MCP) | |||
| Dairy farm household |
Adapted from Jote (2018) [31] with permission of SNV, and modified by the authors.
DAIRY PROCESSING INDUSTRY
Table 6 presents an overview of all dairy processors active in Ethiopia and their products. According to the SNV’s BRIDGE Project (Building rural income through inclusive dairy business growth in Ethiopia), there are 45 dairy processors, including those operated by dairy cooperatives, with a total production capacity of 1,200 MT per day. Among the processors, 31 companies currently operate at only 28% of their production capacity. The private dairy processors process only 2.6% of the annual milk production (4.69 million MT) [7]. This surprisingly small proportion can mainly be attributed to the poor quality of the supplied milk, caused by poor handling, the absence of a cold chain collection system, and an unstable power supply [3].
1) Price (US$) of Pasteurized milk: 1.10 /L; UHT milk: 1.65–1.78 /L; UHT milk imported: 3.22–3.91 /L; Yogurt 1.40–2.00; Cottage (Farm) cheese: 3.80 /kg; Slice cheese: 15.5/ kg; Imported cheese: 41.85; Butter: 30.20/ kg).
1) Adapted from De Raad et al. (2021) [24] with CC-BY.
1) SNNP, Southern nations, nationalities, and peoples.
Furthermore, the milk supply through the formal channel system must be higher. The formal channel system means the authorities control milk by the authorities over the quality, prices, and delivered and produced by licensed operators. The reason is that most of the milk consumed by most urban areas is supplied through the informal sector, mainly by the producers in rural and peri-urban areas, supplied directly to traders and local kiosks, hotels, and coffee shops. Because the informal channel characterizes by low costs of operation due to no license and delivered from producers to consumers directly or through a low number of market agents without control over quality and prices, consumers prefer to buy milk products through the informal channel market [32].
Lame Dairy PLC, located in Addis Ababa, was established in 2007 by the MIDROC investment group with $2 million from the government and a growing milk production company with an additional $4 million investment. The number of employees is about 310, including 100 full-time and daily workers. It continues to play a leading role in the expansion of milk and dairy product consumption in Ethiopia, and its vision is to process 60% of milk in the domestic market. The raw milk is collected according to a contract with the dairy farmer, which is renewed every three months. The milk price and amount collected are determined according to the change in production volume and market price according to the season.
The capacity of the daily milk collected is about 90–160 tons, and the percentage of milk collected directly by 30 milk delivery tank lorries from 60,000 to 70,000 membership farms every day is about 30%, and 70% of milk is collected from milk collection facilities operated by nine dairy cooperatives or MCC. Various milk products are processed, including liquid dairy products such as UHT milk, extended shelf life (ESL) milk, pasteurized milk, and several named cheeses such as Gouda, Mozzarella, Provolone cheese, and local cheeses, butter, and yogurt. In 2021, Lame Dairy PLC produced about 85 tons daily and sold the Shola milk brand at 17 Bir per 500 mL.
For dairy cooperatives’ milk products, according to an SNV’s project, enhancing dairy sector growth in Ethiopia (EDGE) contributed to community awareness raising and purchasing essential equipment, such as aluminum cans for milk collection, milk storage tanks, cream separators, and butter churners. The project provided dairy cooperatives with lactometers for raw milk quality control and cold storage of processed milk products [8].
Nineteen dairy cooperatives were established in late 2017 with 1,362 farm members in 51 woredas in the three regional states of Oromia, Amhara, and SNNPR. The dairy cooperatives supplied nearly 250,000 L of milk in the first six months of the year and produced and sold dairy products such as butter, cottage cheese, yogurt, skimmed milk, and whole milk. In the same period, the total sales amount of the cooperatives was approximately US$135,000, and they earned a total profit of US$12,300, a worth of 9% of total sales despite expenditure (US$107,500) into consideration [31]. This result indicates that one of the dairy cooperative’s goals is to double the income of smallholder dairy farms.
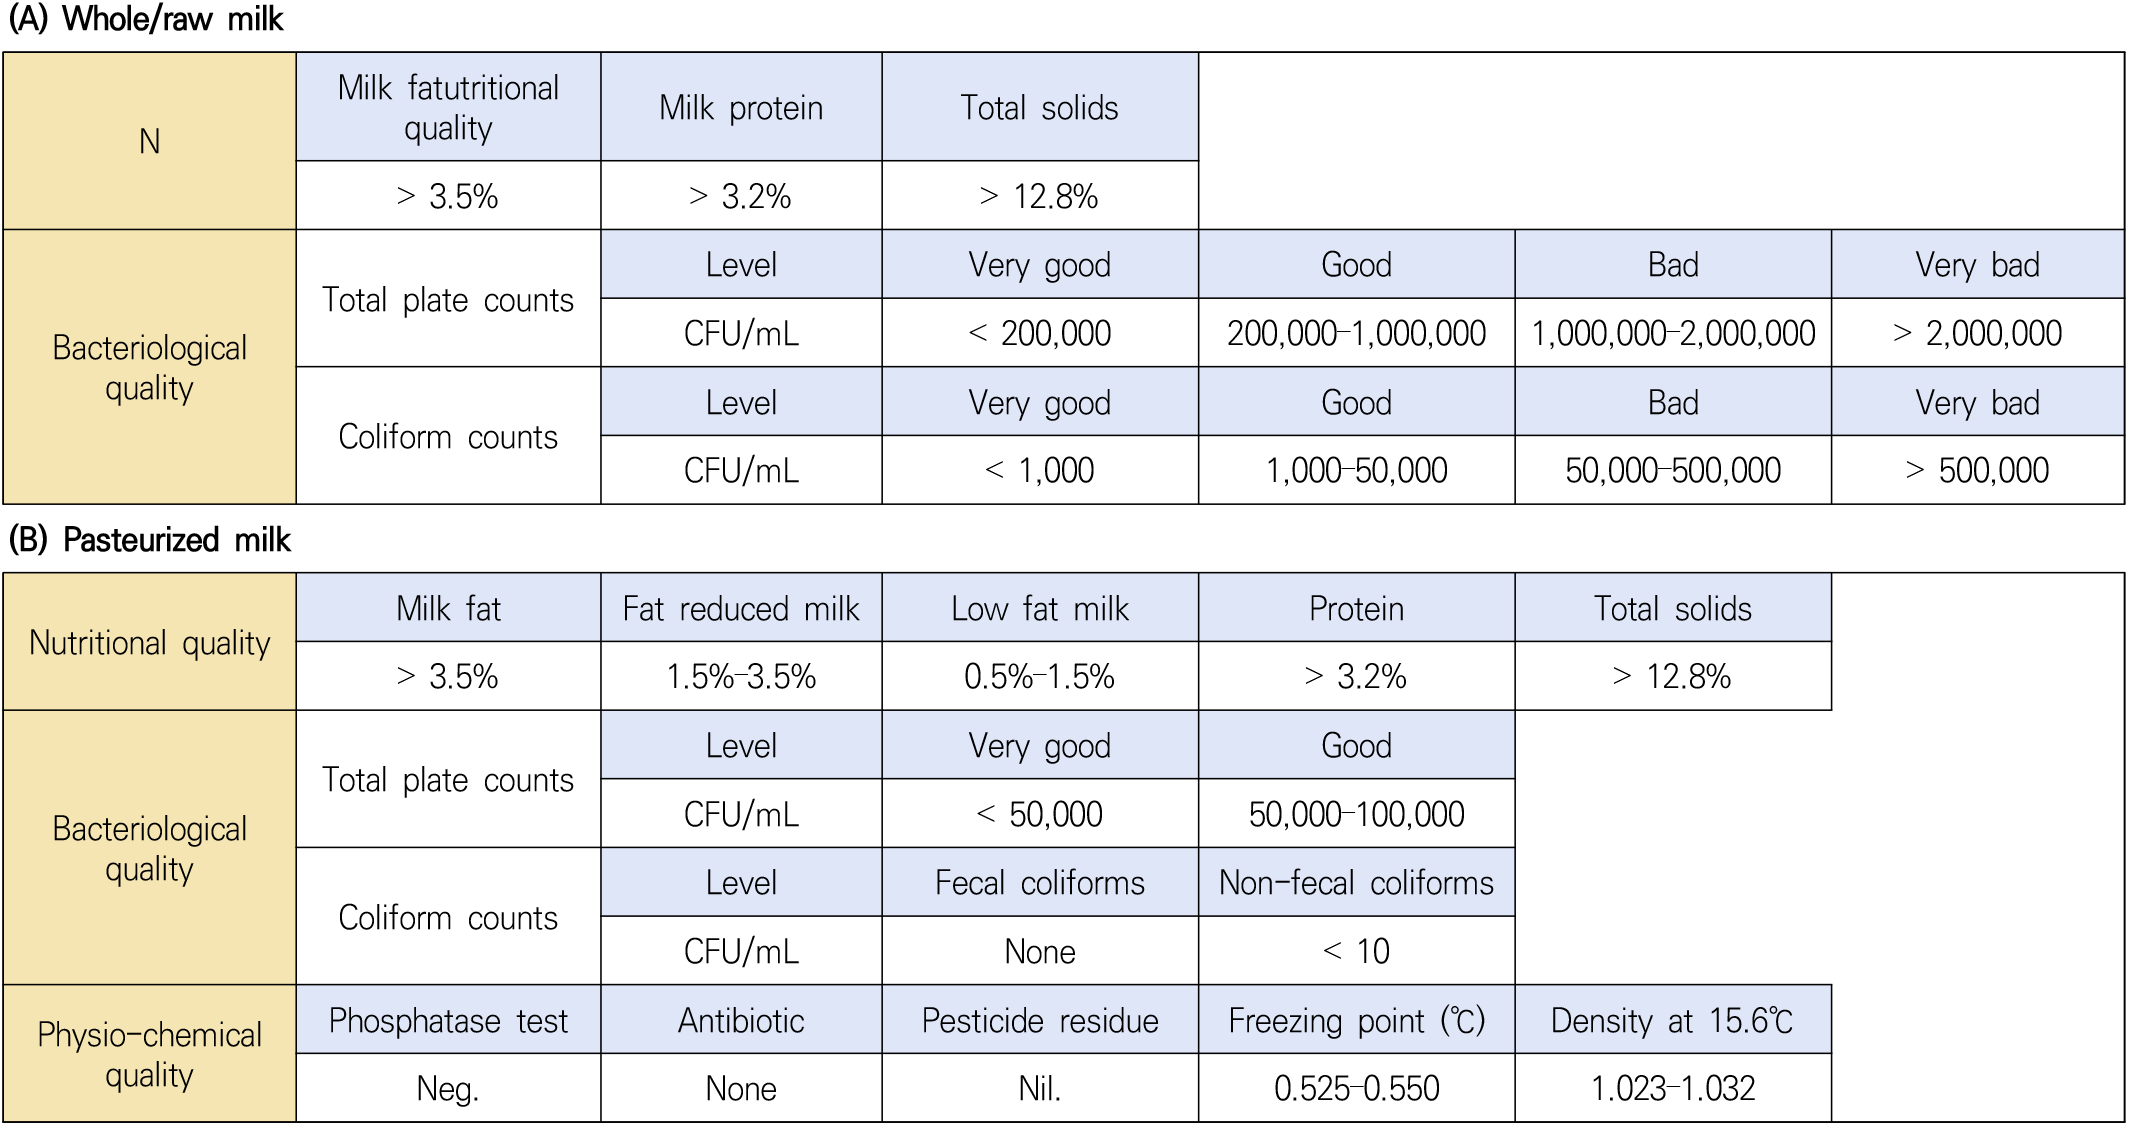
Currently, Ethiopia has no ISO or HACCP-certified domestic dairy producers or processors. Only Mama Dairy PLC was known to produce milk products under controlled conditions by the certified HACCP system as of 2013. There are Ethiopian regulations related to dairy production and processing standards for unprocessed whole/raw cow milk (ES 3460: 2009) (Fig. 2A), yogurt (ES 3468: 2009), cream (ES 3466: 2009), butter (ES ISO 8851-10-1: 2009) and pasteurized liquid milk (ES 3462: 2009) (Fig. 2B) below the standard set by the Ethiopian Standard Agency but compliance to these standards is rare [32]. Also estimation of psychrotrophic microorganisms at 20℃ (ES ISO 8552: 2016), enumeration of microorganisms at 31℃ (ES ISO 8553: 2016), and colony count technique at 6.5℃ (ES ISO 6730: 2016) of milk, yogurt (ES ISO 9232: 2016), butter, fermented milk and fresh cheese (ES ISO 13559: 2016), and microbiological quality control for colony counts (ES ISO 14461-1: 2016) and determination of the reliability (ES ISO 14461-2: 2016) of milk and milk products [33]. Besides these regulations on production processes and quality controls, the regulatory bodies should take strict safety monitoring and quality control management at all levels, from production to consumption.
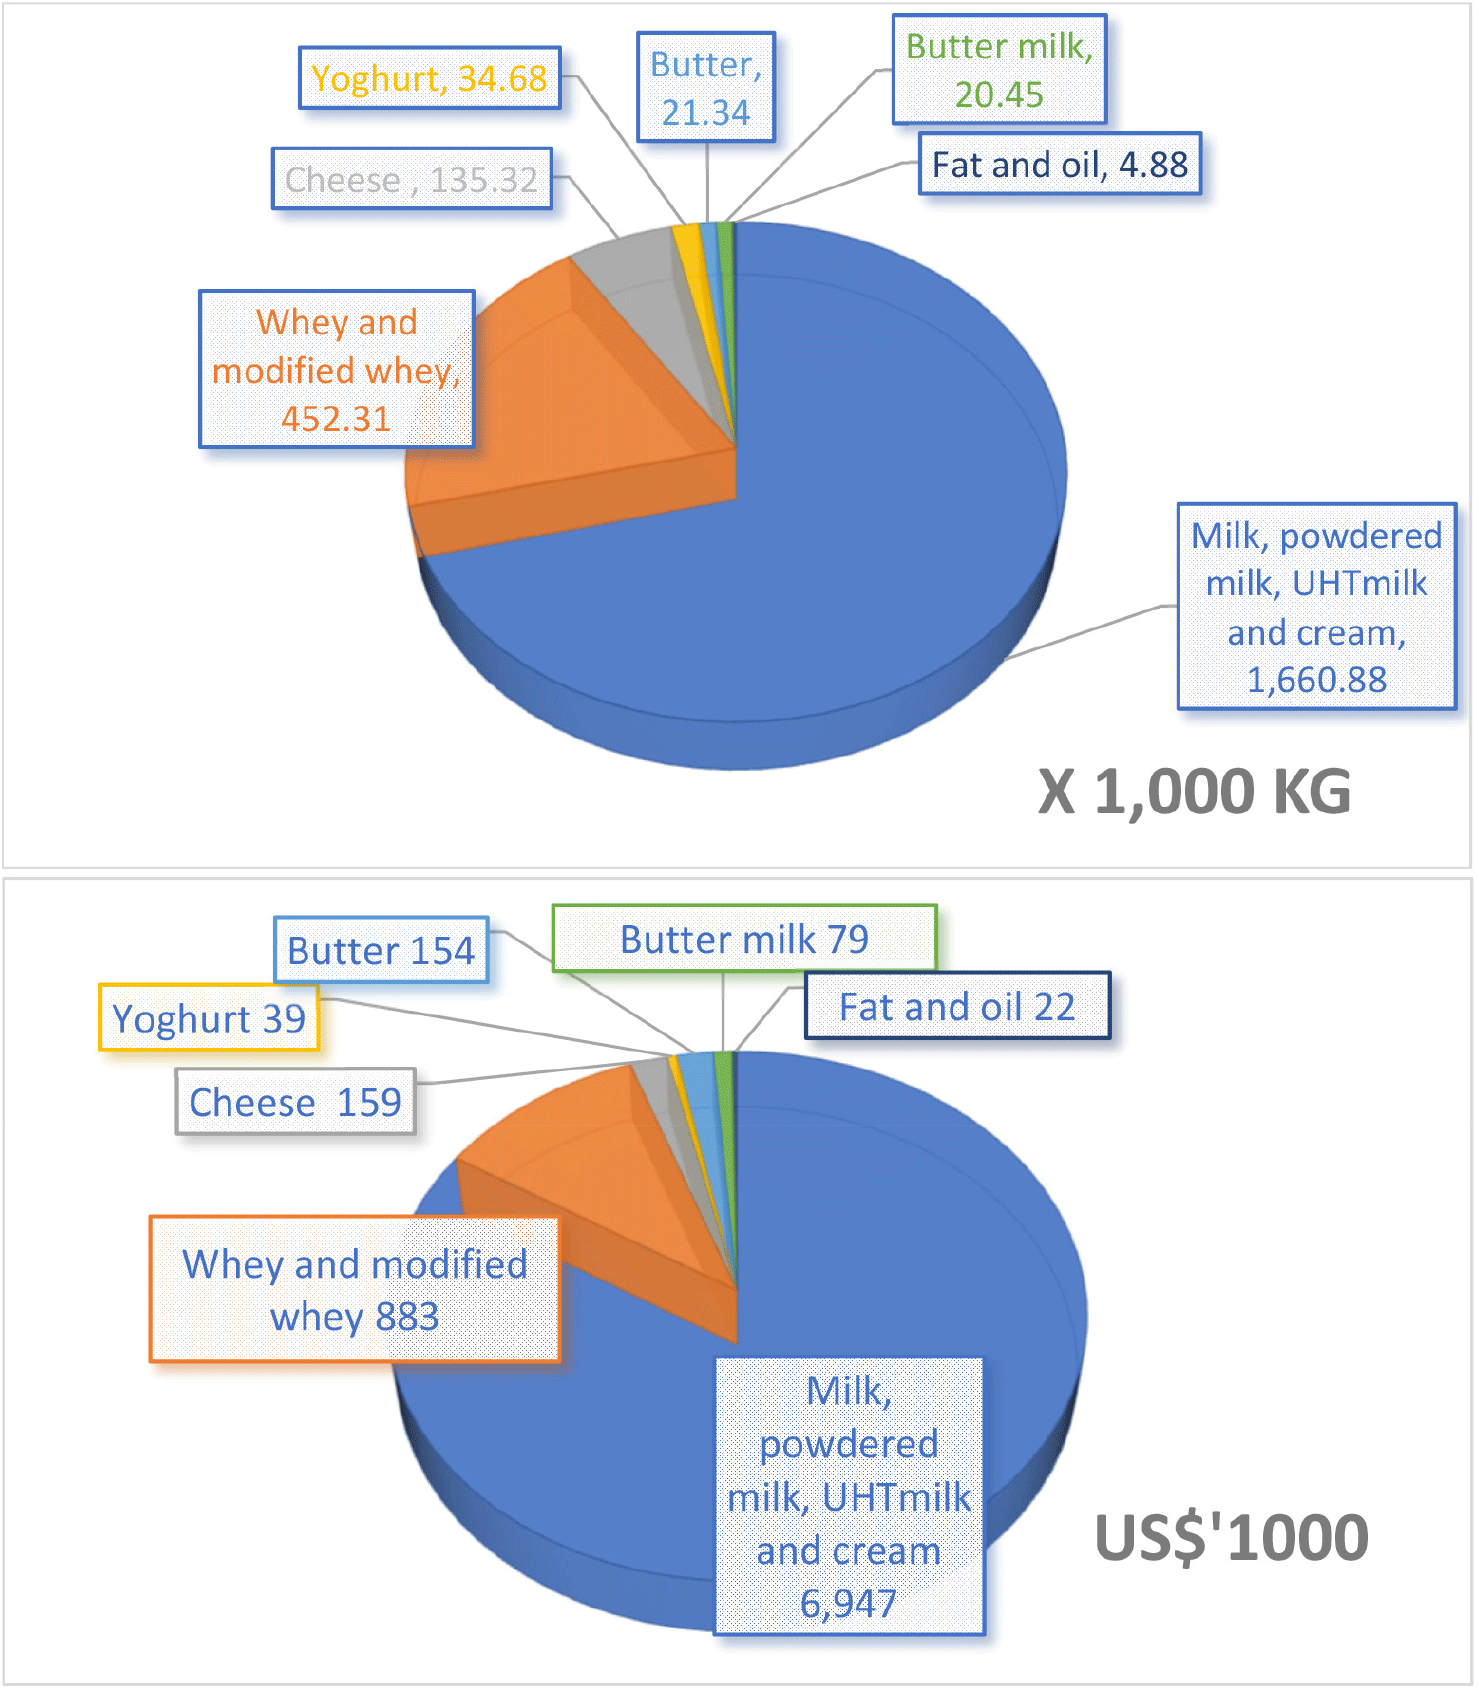
However, Ethiopia imports a significant volume of dairy products through importers/trading agents, wholesalers, supermarkets, and dairy processing plants. Between 2011 and 2015, Ethiopia spent more than US$15 million/year on average for imported dairy products, with the leading share of the spending on powdered milk [32]. From 2015 to 2019, dairy products imports averaged around US$8.28 million per year, which amounted to an average of 2,328 MT/year. A view of the Ethiopian dairy sector and its contribution to the country’s economy was reviewed by Mihret et al. [34]. Among the 2,328 MT of imported dairy products per year, milk, milk powder, and UHT sterilized milk and cream made up 71.3% of dairy import volume (Fig. 3), followed by whey products (19.4%) and cheese (5.8%). Ethiopia mainly imports powdered milk and cream from the Netherlands, New Zealand, and Switzerland; cheese from Egypt, France, and the Netherlands; and yogurt from Spain, France, and Germany [24].
CONSIDERATIONS IN THE SURVEY AREA
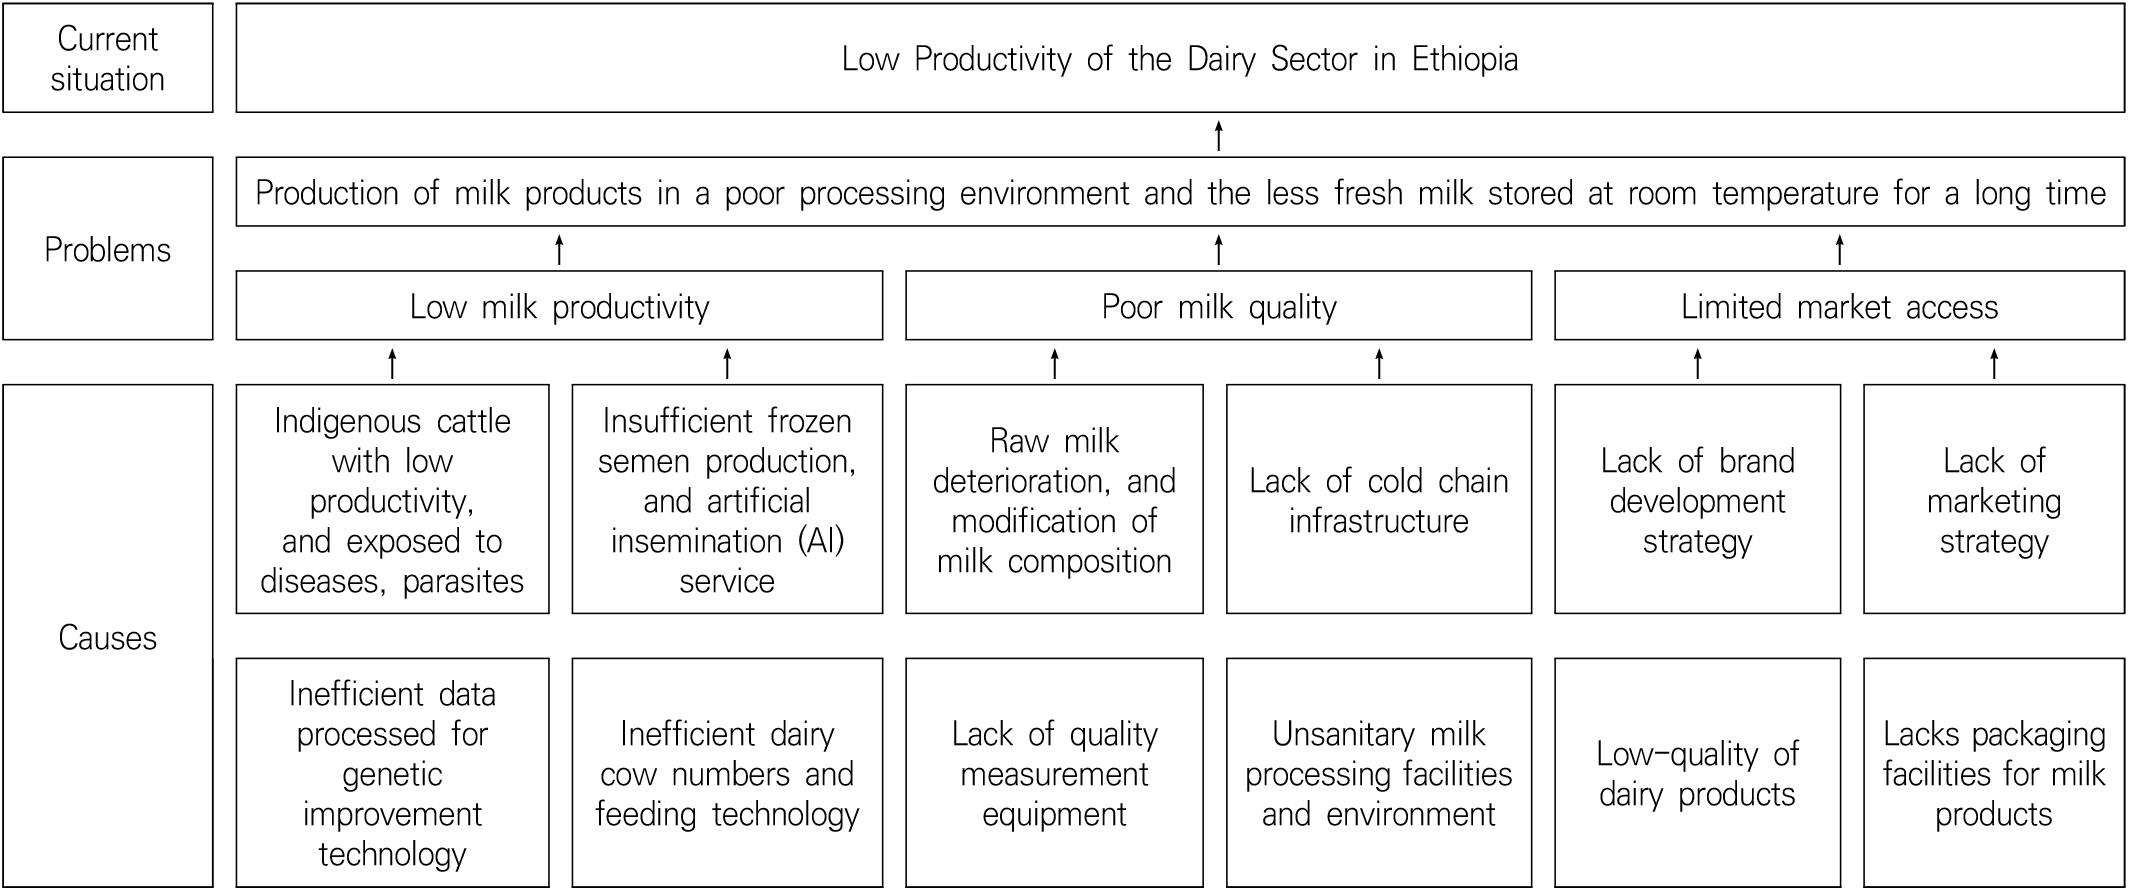
The main problems in the dairy industry could be accounted for by low milk productivity, poor milk quality, and limited accessibility to the market (Fig. 4) [35]. The dairy industry must address these challenges so that it can produce milk and milk products that satisfy Ethiopean consumers.
Ethiopia has about 70 million cattle, the largest population among 50 African countries, and the fifth globally. Of these, about 15 million were reported to be milk cows, of which only 0.31% are exotic breeds, and about 2.29% are known to crossbreed [24]. The milk production of indigenous cows depended on the species, lactation period, and rearing technology, but the average milking volume was about 1.9 to 2.9 L/d. In a study on spatial heterogenicity in farm productivity, an increase of the travel time to Addis Ababa by one h decreases the daily production of raw milk by dairy households by 2.7 L and the daily milk productivity by 0.8 L/cow [14]. Considering that the number of full-time dairy farms is minimal, and most are small-scale dairy farms, the average milk production per farm is 5–10 L/d. This low productivity not only adds to the burden on farmers who go into milk production costs but is also a hindrance to forming a profit structure.
The cattle’s health is a factor that significantly affects milk production yield and productivity. Generally, diseases in dairy cows affect reproduction, milk production, and quality and cause mortality and morbidity. It was reported that Foot-and-mouth disease (FMD) with an animal-level seroprevalence of about 9%–26% with a herd level of 48% [36], Giardia infection [37,38]. It was also reported that the animal level prevalence of 25% of the herd (herd level prevalence of 44%) was infected with lumpy skin disease with morbidity of 10%–17% [39]. The infection of contagious bovine pleuropneumonia differs according to agroecology, and 40% of the lowland livestock is the most severe [40]. Bovine tuberculosis is prevalent in urban and peri-urban dairy farms (55% at the herd level and 32.3% at the animal level [41]. Duguma et al. [42] reported that Stap. aureus (43%) was the most dominant isolate. Micrococcus spp., S. agalactiae, and S. disgalactiae were also isolated from 275 quarters infected with clinical and sub-clinical mastitis among 90 crossbreeds in Holleta national research center. Lemma et al. [27] reported that about 50% of cows were infected with mastitis in both Chiro and Gemechis districts, and 87% were Black Leg as a prevailed disease in Gemechis. Veterinary diagnosis services and treatment for emerging cattle diseases are not provided to dairy farmers, resulting in high calf mortality rates. The price of livestock medicines and pesticides continues to rise, adversely affecting the profitability of dairy farms. Trypanosomosis (43%) and parasitic infection (36.2%) prevailed in the lowland (n = 58), trypanosomosis (31%) and pasteurellosis (31%) in the highland (n = 42), but leeches (36%) and pasteurellosis (22%) in the midland (n = 50) [17].
Benti et al. [17] explined that 89.5% farms prefer natural mating system above AI system because AI service is not accesibble at all in Bako Tibe district in West Shewa zone. It is essential that AI technician should arrive at the farm at the right time for fertilization with the fsemen stored in a forzen liquid nitrogen container. In Ethiopia, however, the production efficiency is low (35%) due to the failure of the liquid nitrogen cryo-generator and the delay in replacing parts. 98% of 150 farms had in low conception rate, where natural mating was practiced, and AI inseminated only 2%. Therefore 45.3% of 150 farms have their breeding bulls, and absent, use neighbors’ bulls (42.7% of 150 farms). Because it is common to raise the bulls with cows all year round, so breeding is thus not controlled by the farmers [17].
In Ethiopia, the national conclusion has been reached that it is desirable to apply a breeding cows improvement scheme that produces crossbreeds in large numbers. However, milk production of native, crossbreed and valuable species is determined mainly by feed supply technology, such as the roughage ratio to enriched feed. According to Brasesco [32], in the Arsi highlands, a milking cow of an indigenous breed produces about 2.6 L/d of milk. Boran breed in the Asella area consumed 3 kg of concentrate feed daily, then productivity increased to 5.9 L/d, which reflects the relationship between milk productivity and the better supply of concentrate feed. Holstein crossbreed in the Arsi zone reached up to 9–11 L per day by two milking times, and some farmers got up to 17 L/d. While Holstein-Friesian cows kept under good management circumstances in the East Shewa zone consumed 8 kg of concentrated feed and could produce 23 L/cow/d. However, the price of concentrate feed in 2020/2021 reached 22–23 Birr/kg [10], escalated in price from 6.1 Birr for dairy ration, 8.56 Birr for calf ration, 6.44 Birr for heifer ration in 2015/2016 [43]. Because such a high price of concentrates-feed has a competitive relationship with the unit price of food, it cannot be affordable to supply a sufficient amount of high-quality concentrated feed in small-scale dairy farms. Insufficient concentrate feed will cause malnutrition in cow’s body development and cannot obtain the BCS, which is required for high mating efficiency and good milking capacity.
Up to now, the 25 native cattle species are adapted to the climatic environment and diseases and pests, and donor countries worldwide have tried to develop and establish milking cow species suitable for Ethiopia’s climate environment. However, despite 100 years of efforts, either breeds with high milk yield or fixed genetic traits have yet to be. Edea et al. [44] investigated the genotype of native Ethiopian cattle species for ten years and concluded that all efforts to settle down indigenous Ethiopian and Korean native cattle (Hanwoo) failed. Investment in performance recording will pay off in the long run for selecting the best animals/bull dams at private farms for further breeding [45]. For the genetic data collection in Ethiopia, an old data processor (Server Model: HP Proliant DL380 Gen9 provided by the Finnish Government 40 years ago is currently being used in the National Dairy Cattle Database Center. This processor is (8 TB of storage, and 256 GB of RAM, Server link: https://www.hpe.com/psnow/doc/c04346247), outdated for the improved informatization system secures data on various genetic traits.
According to an assessment of the management routines and hygienic practices of cow’s milk at 120 small-scale dairy farmers from 12 rural kebeles, two districts in west Harargae Zone, Oromia regional state [27], teats of cow udder cleaning before milking practice were reported by 51% of Chiro district farmers and 49% by Gemechis district respondents. Some smoked plants, such as Ejersa or Olea Africana, are in use to clean the milk holding utensils, but the chemical component and the content playing as sterilizers were not identified. Cow mastitis was a suffering disease, and the shortage of grazing land (93%) and disease (75%) were challenges/ constraints for the respondents. In a microorganism study investigated in the highland of Oromia regional state, 108 dairy farm milk samples were counted. The total mesophilic aerobic bacteria and coliforms were 8.2 and 8.58 Log10 CFU/mL, respectively. The overall mean of titratable acid (TA, %) reached 0.27% in the range of 0.16 to 0.44% [46] was too high level, which level is not suitable for heat treatment for processing. Kuma et al. [47] assessed the raw milk microbial quality produced in Addis Ababa. A high level of coliform bacteria (5.42 ± 1.74 Log10 CFU/mL) was counted, and the same level (5.78 ± 0.99) was detected in the raw milk in the Sebeta site. Such a poor quality of milk would be rectified by delivering milk by cold chain system from farms to milk collection group (MCP) and from MCP to the processors.
Milk and milk products can be easily adulterated with foreign materials purposefully. Standard adulteration practices include skimming the fat, adding water and flour to milk, and for butter with banana and other vegetable oils. However, milk products should be inspected and controlled in the marketing routes except at the dairy plants. A need for milk-quality standards control and enforcement, as well as grading and pricing policies, was one of the challenges and strategies in the dairy sector of the GTP II plan in the execution year of 2015–2020 [48]. About 30% of raw milk from 50 farms and 70% of pasteurized milk from 55 processors were reported to add water to get higher milk quantity, so the lactose content resulted in a decrease to about 3.2%–4.4%, compared to lactose content of 5.54% (crossbreed 5.66%, local breed 5.43%) of Zimma zone of Oromia regional state [49].
The chemical components of raw milk collected from small-scale farms (n = 108) in peri-urban areas of Ejere, Walmera, Selale, and Debre Birhan districts in the central highlands were 3.76% milk fat, 3.10% milk protein, 5.08% lactose, and total solids and solid-not-fat (SNF) contents were calculated 12.24% and 8.56%, respectively [46]. It was reported that about 30% of raw milk (n = 50) and 71% of pasteurized milk (n = 55) were diluted with water. The more surprising reality was to know that in 10% of raw milk and 9% of pasteurized milk, a harmful substance was added illegally to the milk in order to retard the acidification by the growth of acid-producing spoilage microorganisms. Milk component adulteration induces a severe problem in the point of public health concerns and a reliability loss in the quality of domestic milk products from consumers. Farmers and processors should be aware that keeping the standardized value of specific gravity (≥ 1.032) and titratable acidity (≤ 0.18%) of fresh farm gate milk is more important rather than the efforts to increase farm milk volume. In an SNV investigation on milk quality in 2021, most stakeholders in the milk collection line, such as dairy farms, milk collectors, dairy cooperatives, and dairy unions, seemed to have original fresh raw milk composition with the foreign components not permitted. For this reason, abnormal milk was also being collected voluntarily due to the shortage of milk production volume and intended to sell in the informal channels. The milk products are directly manufactured by commercial dairy processing farms or other donor country’s farms equipped with processing facilities sold through formal channels. Also, a compulsory revision of strengthened milk collection regulation, such as education for improving awareness of foreign substances except for the natural state milk components that threaten human health and adoption of a penalties system imposed on the milk collection points MCP and the MCC are essential preconditions.
The milk collection system of the dairy union proceeds in three stages. The individuals deliver morning milk from the farms to MCP. The milk quality test is conducted at MCP using the specific gravity test and sometimes alcohol test and keeping the milk holding bowl alongside the street without cooling storage. Then the milk bowls were loaded into the MCP vehicle, which eventually became a factor in further deteriorating the milk quality exposed to hot outside temperature. Although the distance to bring the unsanitary plastic milk container from the farm to the MCP is about 3 km, it takes about 2 hours to reach. The whole process of milk collection takes at least 5 hours to be cooled down when about 40 milk cans and a lot of small size plastic containers from a transportation truck are unloaded, filtered, and transferred to the cooling tank to start cooling, but failure to observe the milk cooler operating. Minten et al. [50] insisted that a challenge limiting development includes inadequate availability of MCC with chilling tanks for dairy cooperatives or the private sector. In addition, the underdeveloped short value chain has limited spatial outreach, so the access of rural consumers to milk could have improved. In addition, about 200 days of Orthodox Christian fasting can affect the consumption of milk and increase wastage affected.
The Iteya Dairy Union comprised 130 members and 4 MCPs, in which stage, an alcohol test and a specific gravity test should be performed to check the milk’s freshness and weight for payment. However, it was heard that the tests were not performed because of a shortage of 75% ethyl alcohol supplied. The milk collectors would not provide glassware for the tests, and a lactometer was unavailable, which gives data to detect the water-addition levels of abnormal milk. Procurement of laboratories for the chemical analyses of milk components and microorganism contamination to Arsi University is a substantial contribution in terms of operation capability by the highly trained technician for analyzing instruments without any intervention of stakeholders. The acquired data on milk can be transmitted to the variables to determine the price of farm-gate raw milk according to the freshness, nutrition, and safety points of view so that it may be helpful for the adaptation of a milk price-differentiated payment system. Suppose the best way to improve milk quality is to apply the supplier’s economic logic to the market price. The dairy farmer’s reaction will also move toward selling milk at a higher price, that is, supplying fresh, nutritious, and highly hygienic quality milk like other dairy-developed countries. Instead, milk processors will also need to pay attention and invest in the milk delivery lines so that fresh milk from farm milk can be kept fresh even in the process of receiving.
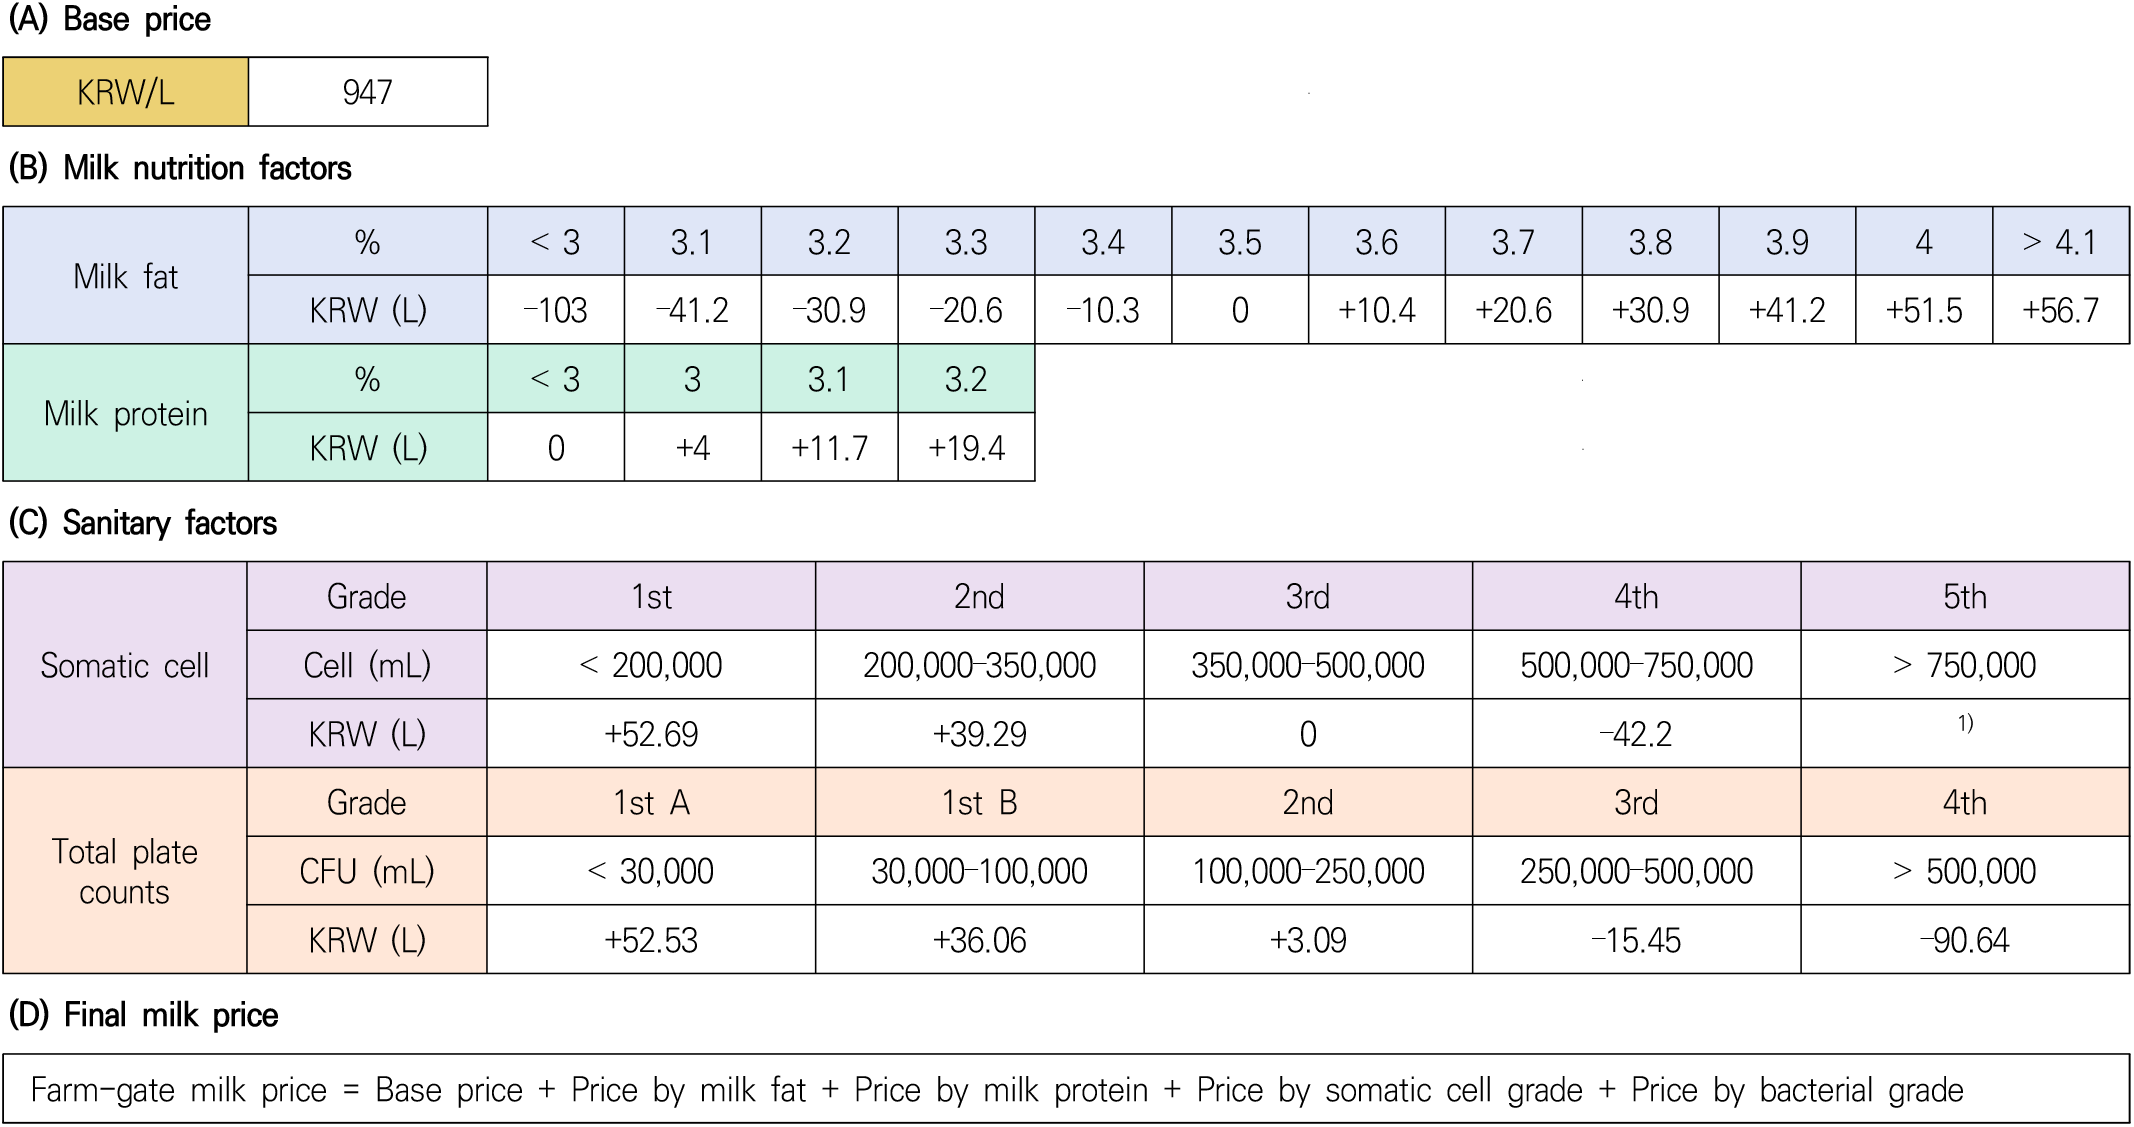
The following equation calculates the farm-gate milk price in Korea.
The base price per liter was KRW 947 in 2021, and the price is changed depending on four factors fixed in 2015 [51] (Fig. 5), which is one of the highest in the world, but it can be prompted efficiently upgrade the hygienic quality of the milk. As a result, the nutrition contents were increased to 3.8%–4.2% milk fat and 3.2%–3.4% milk protein of Holstein cows’ milk. Furthermore, the hygienic quality reaches the top level in the total bacteria number, 1st-A grade milk accounted for 90.7%–95.4%, and somatic cell count 1st-grade milk accounted for 57.5%–73.0% of the total milk produced in 2022 [52,53].
In the two dairy cooperatives producing for direct on-site sale, not for market sale, a cream separator, and a butter churner were installed on the soil floor in the processing room. One dairy cooperative was equipped with a manually operating cream separator, and the other with an electric cream separator. The milk processing capacity of the cream separator of both cooperatives was about 30 L/h and the wooden butter churner was manual type. For enhancing the processing environment and equipment from such inferior conditions to meet the hygienic standard as defined by CSA, it is inevitable that dairy cooperatives must invest financially and improve their technical know-how.
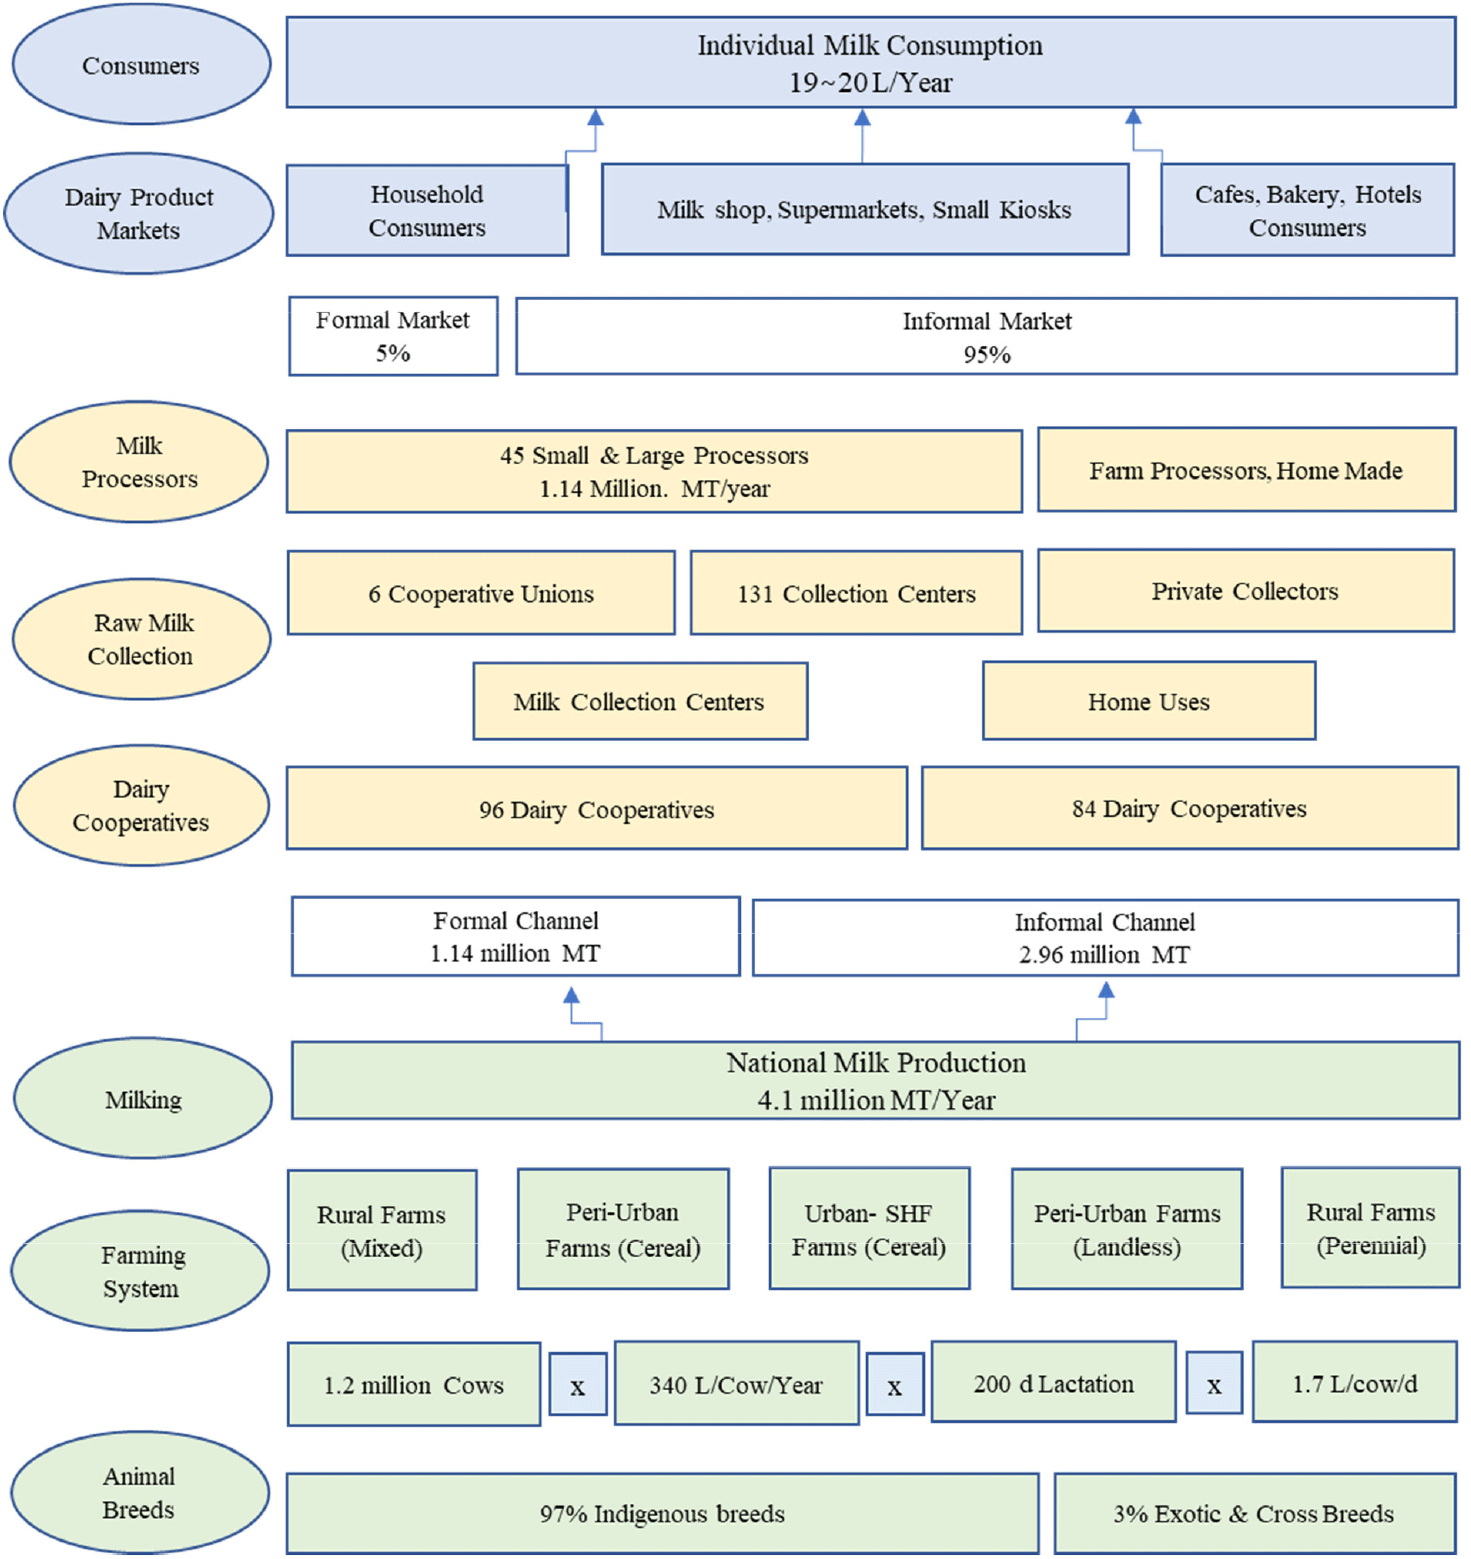
The current dairy value chain of Ethiopia can be summarized in Fig. 6. Only 5% of milk products are sold through formal market and 95% of milk supposed to be consumed at home without commercialization.
Although the visual quality of the butter of a local dairy processing cooperative, visited for this investigation, which was stored in a plastic barrel seemed to be sound, the preservation temperature was likely conductive for the growth of spoilage bacteria, which will bring about a rapid rancid. Also, the safety of the product seemed insecure due to selling without microbial inspection. Because there was no packaging machine found in the dairy cooperative, the butter was manually packed into a vinyl bag using a scoop made of wood. The pasteurized milk and yogurt have been produced in small quantities through a consignment to a middle-size private milk processor, I-MAX PLC, nearby.
Bocoji dairy cooperative was one of the three dairy processing cooperatives that opened public relation booth held at a Poultry Symposium in Addis Ababa during our visit. At Symposium, their own made butter and three types of OEM-made dairy products had been on selling to the visitors in the event. However, the marketing strategy for the milk products of these cooperatives didn’t make them successful, the main reason for this is because the production volume was not enough to supply the market demand so far. To make its marketing strategy accelerate, it will be effective to increase the production volume through the supply of production facilities with the support of the ODA program. As a resource for increasing raw milk, the evening milk, which milk collectors are not in a position to receive due to their being a way to keep the milk during the night, which supposed to be used for commercialization, instead consumed at the household level by the producers. On the other hand, if there is financial support or credit facilitated for install the regular sales place the local dairy cooperative can sell to the visitors such as at their own operated milk café, and by this, the marketing strategy of each dairy cooperative will be activated much more.
CONCLUSION
Every stakeholder in the dairy value chain must adapt to new dairy industry environments and require enthusiastic efforts to transform from a means of subsistence to a market-oriented mind. Since the prosperity of the dairy industry is one of the driving forces for the economic development of Ethiopia, the government has to take efficient measures to support the dairy sector. In the front of transformation to the levels of urban SHF farming system showing a high farm performance, many constraints to be solved exists. It might be the breeding of genetic resources, enhancement of raw milk quality, supply of feed concentrates, and expansion of the formal markets. In addition, a consistent development strategy by the government for providing the pertinent reform, such as Ye Lemat Tirufat Legacy, needs to adapt actions like the execution of a new milk price determination system depending on the quality grade. Primarily, it cannot emphasize enhancing the labor efficiency of dairy farmers and upgrading the genetic traits of research institutions to ensure the high performance of livestock. Secondly, intensive investigations need to increase the ratio of farm raw milk selling through formal rather than informal channels. Finally, procuring milk processing modules for the dairy cooperatives is necessary to achieve the economic goals by strengthening the milk processing technology and market-oriented new product development capabilities.